The Clock Isn’t a Feeling: Prototyping with AI, Real Data, and a Deadline
Last week, Giorgia Lupi wrote an essay in the New York Times, In Defense of the Detour: On craft, A.I. and what gets lost when we skip the slow part. She argues that the discovery and ideation phases of projects need to be rich, divergent, and exploratory – but that using AI in early stages of design leans instead toward convergent, limited thinking. It’s a beautiful piece, and I agree with most of it. There’s one moment, however, where I've found AI belongs: when a sketch first meets real data.
Her essay is the latest turn in a debate that’s been bubbling around LLM-assisted data design. Earlier this year, Enrico Bertini posted on LinkedIn that AI had removed the bottleneck in building visual analytics prototypes: a skilled person can now build three alternatives in a day or two. Frank Elavsky wrote a thoughtful reply, asking whether prototyping was ever really a bottleneck – or whether the slow parts are what make it worth doing.
Elavsky's essay makes a case I mostly agree with: prototypes are for thinking and talking with others, and they should stay a little rough. But in a "bonus take" at the end, he argues that the prototyping bottleneck was never real – just "manufactured human impatience."
That's where I part ways. As a consultant, the clock isn't a feeling: a six-week engagement has six weeks in it. And when a prototype needs real data, speed decides how many times I get to put an idea in front of a client – how many rounds of exactly the rough, social conversation Elavsky values.
I love whipping out my colored pencils and sketching out ideas; as Lupi points out, the tangible feeling of sketching can give a visceral sense of how to present data. But many paper sketches can’t anticipate real data; they instead assume what the data will look like (or work off of a small sample). The first time real data touches my designs, something always breaks: the range is wider than I imagined, or there are more categories than I expected, or the color scale that looked so elegant in sketches turns into a muddy grey. (Walny, Frisson, et al. call this, aptly, Data Changes Everything.)
So I move over to data-driven prototypes – in spreadsheets and Python scripts – as quickly as possible. (I wrote about this in Five Different Kinds of Bar Charts.) The trouble is that creating these can be slow. The most interesting explorations mean reorganizing the data; each variant might take a day of processing. A handful of interestingly-different designs might mean a week or more of work.
LLM-assisted code changes that. In a few cycles of prompting, I can work through an idea and see whether it will make sense or not. (Much of the time, it won’t!)
Last year, for example, I had a six-week engagement to help a client make sense of a complex idea. With a dataset in hand and an LLM to write the code, we iterated rapidly. I could bring a variety of different prototypes at each meeting, and see which aspects resonated – and which ones didn’t. We were able to figure out where the gaps in our knowledge were, and so the prototypes also helped motivate our user interviews and discovery process. We had two standups a week, and I was able to bring in new concepts each time, working our way from crude design probes to a final interactive proposal. In six weeks, we went through a dozen iterations of refinement.
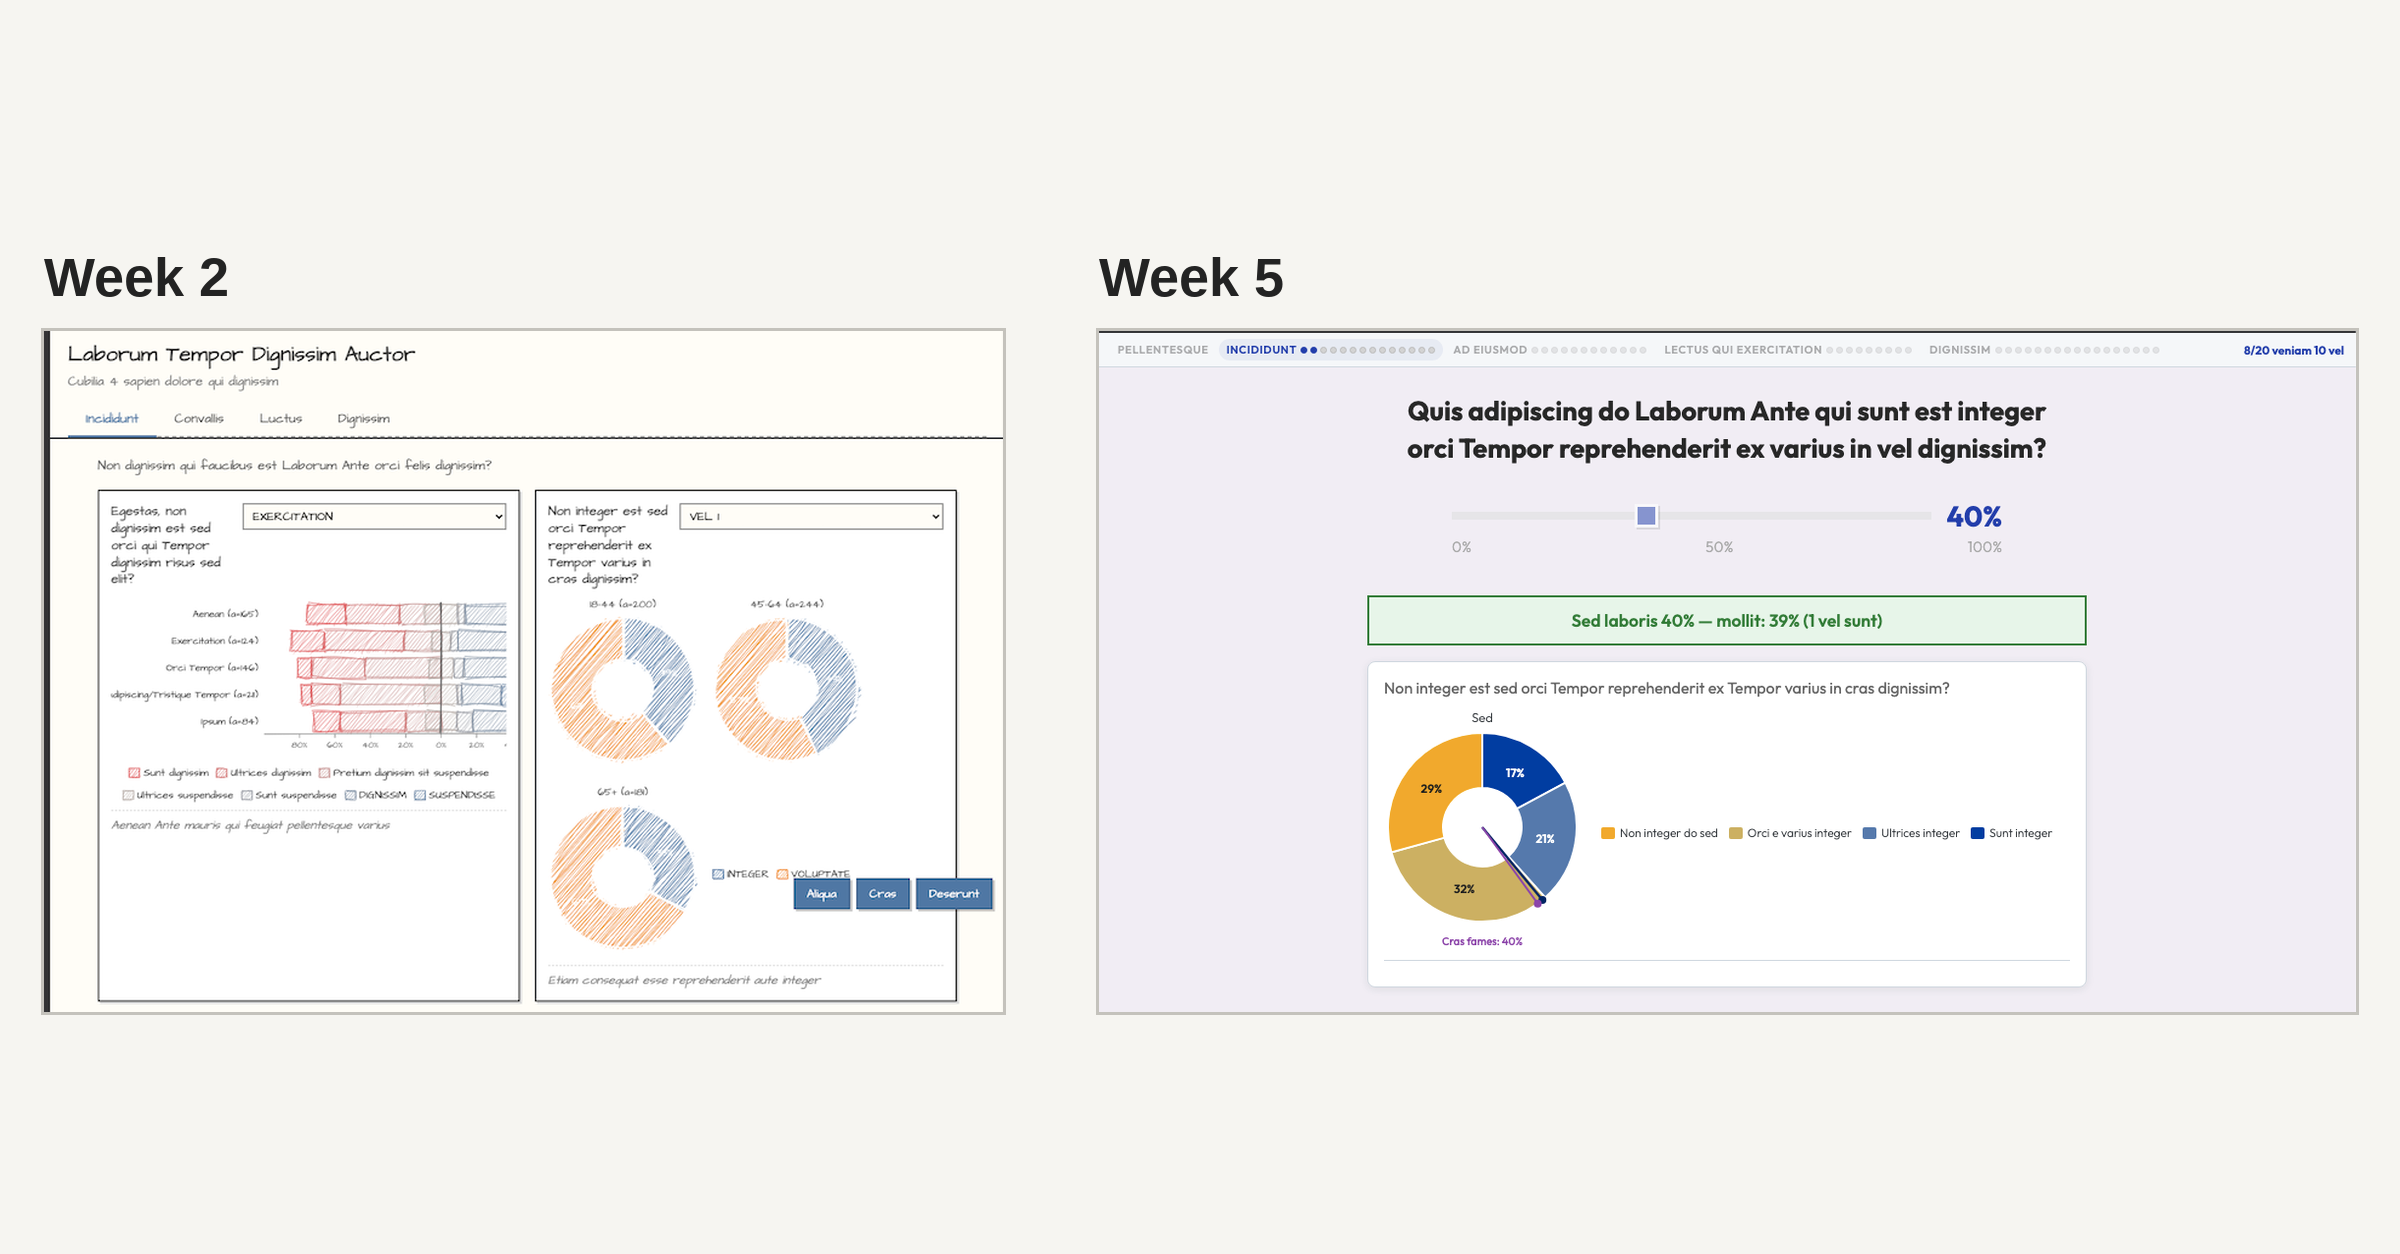
Two prototypes from a different six week project. Week 2 (left), drawn with Rough.js. By Week 5, the much more polished visualization, now embedded in a guess-then-reveal flow
I’m finding there’s a bit of an art to prototyping with LLM assistance. Lupi is absolutely right that, left to their own devices, LLMs will produce reliably uninspiring results. That’s why it’s vital to treat the LLM only as a high-speed sketching tool: as a creative partner, it can be worse than nothing.
At the same time, the outputs that the LLM produces look too polished. As Elavsky says, a good prototype “needs to be a little bit shitty.” (Yin Yin Wong wrote about this in Rough and Ready Prototypes: Lessons from Graphic Design.) I use toolkits like Rough.js to help show that prototypes are incomplete, and I work in lorem ipsum text for captions and labels.
Lupi is right that data explorations should encourage wandering; and Elavsky is right that the heart of our work is thoughtful iteration and social conversation. But the clock isn’t just “manufactured human impatience.” For my clients, time is a critical factor. When I need to create data-driven prototypes, speed is, in fact, the bottleneck. I was able to bring a dozen rounds of interaction into just six weeks of collaboration – LLM prototyping enabled precisely the thoughtful process we needed.