Projects
Design research and visualization for tools that specialists rely on: client projects, research from my Microsoft Research years, and a few things I built for myself.
Client work
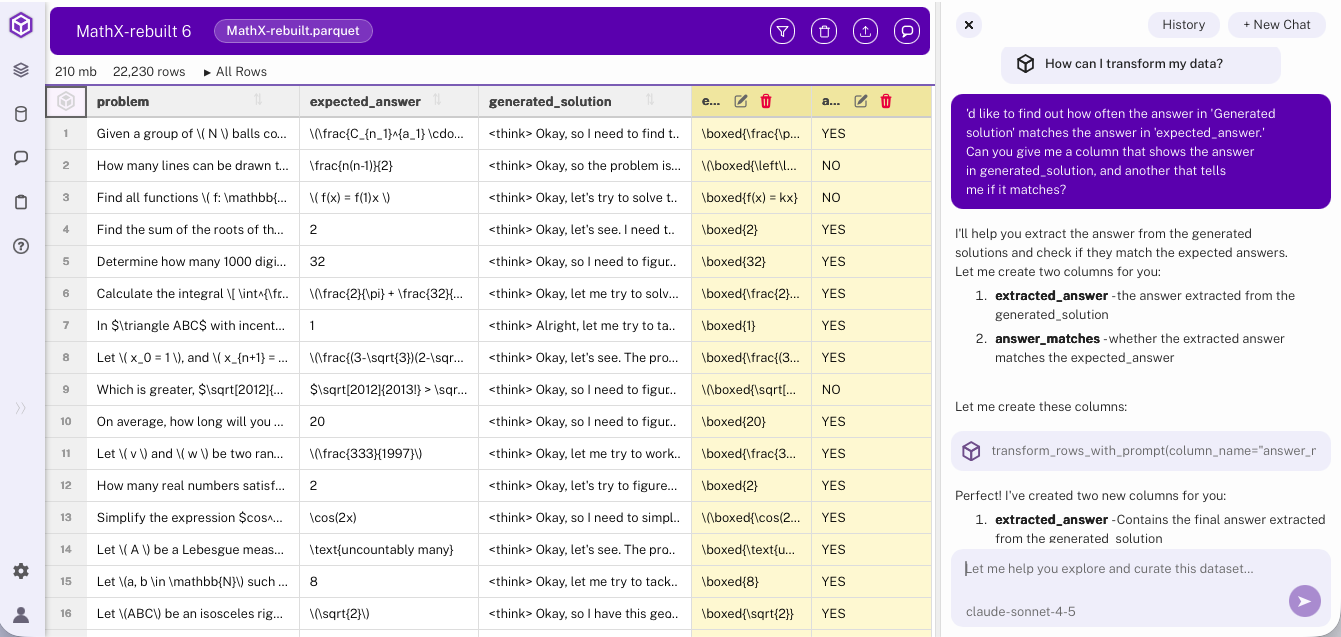
UX for data cleaning
A review of the user experience of Hyperparam, a bespoke tool for rapidly cleaning and transforming large datasets.
Hyperparam · on the Data Blog
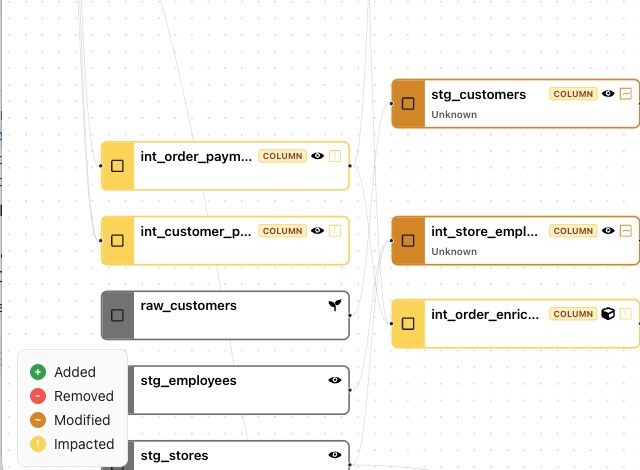
Recce
Showing data engineers how a change to one model ripples through the pipeline, and comparing the data before and after.
Recce
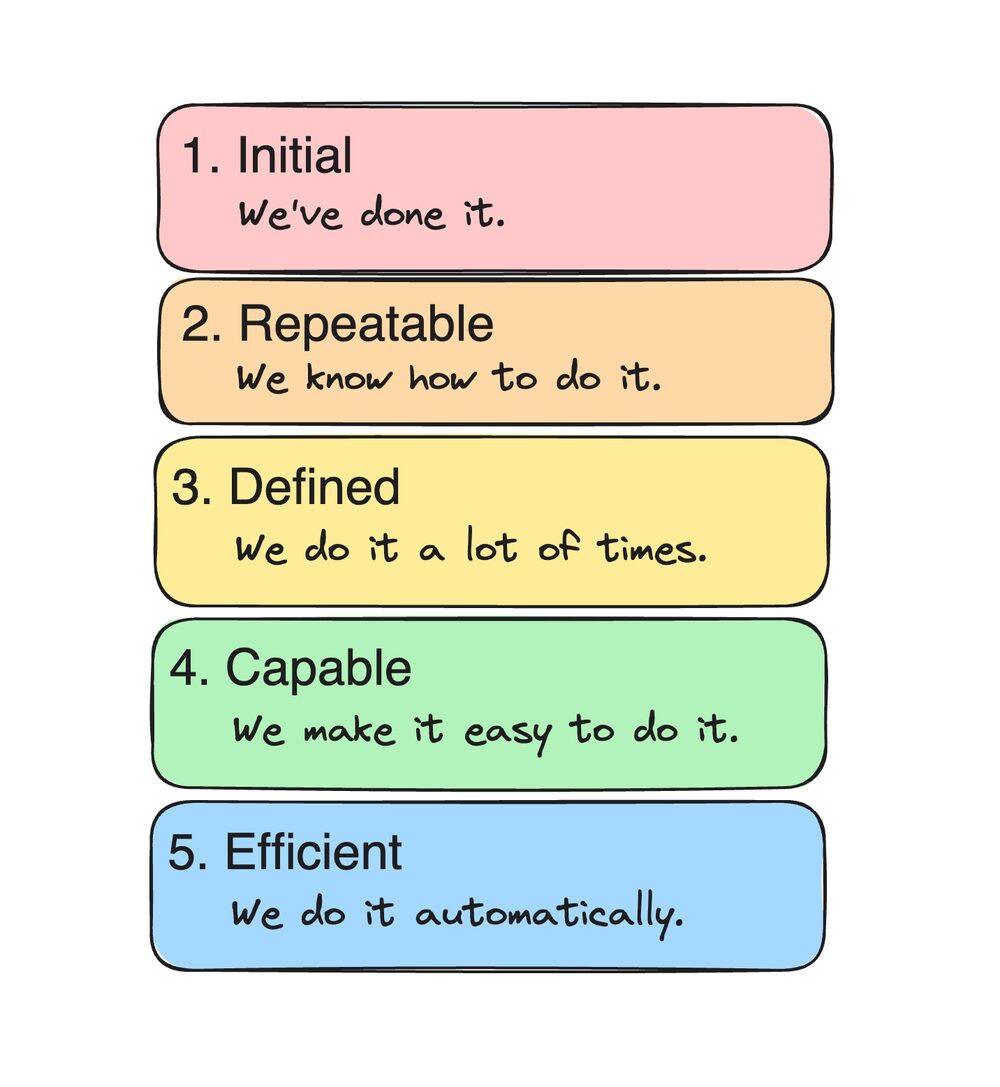
Automation at Moment
Interviews with infrastructure teams, turned into a product direction with maturity models.
Moment · on the Data Blog
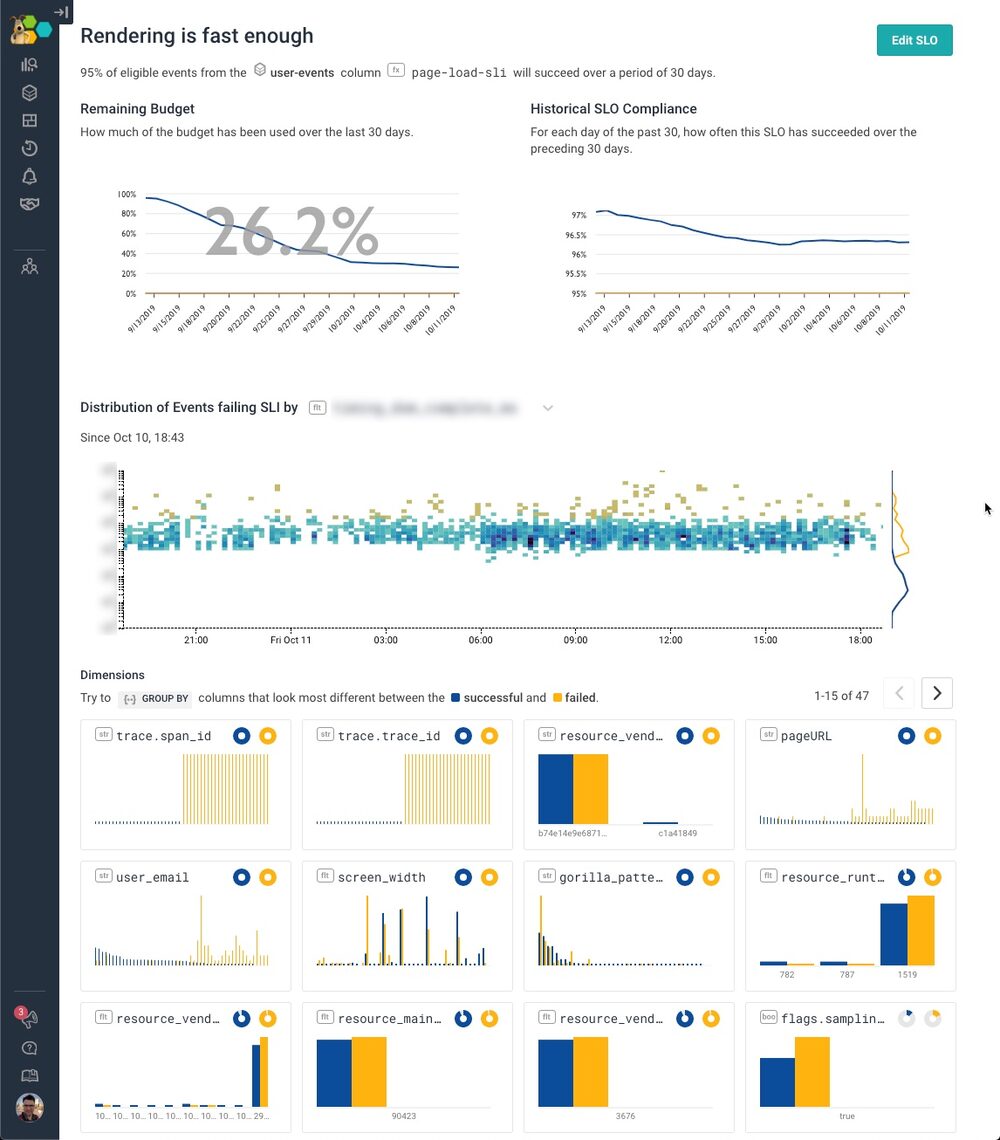
Service level objectives
How we built Honeycomb's SLO feature, from spreadsheet and notebook prototypes to a product, with Liz Fong-Jones.
Honeycomb · on the Data Blog
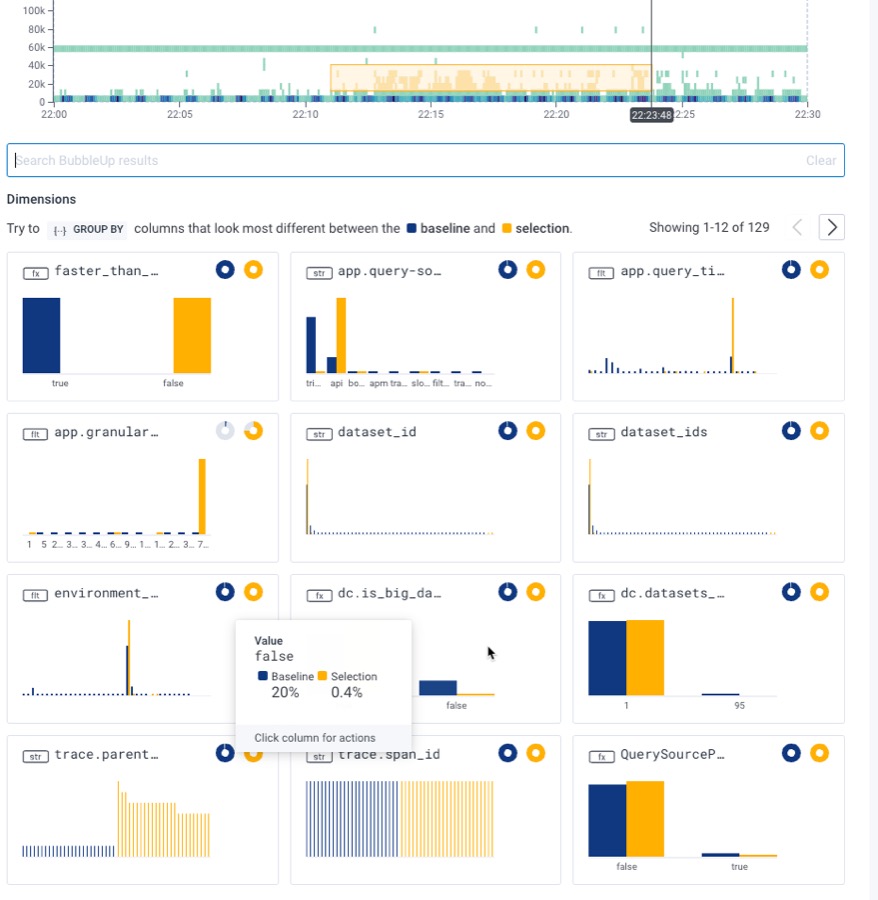
The Core Analysis Loop(opens elsewhere)
How users carry out the work of incident analysis and recovery.
Honeycomb
Research
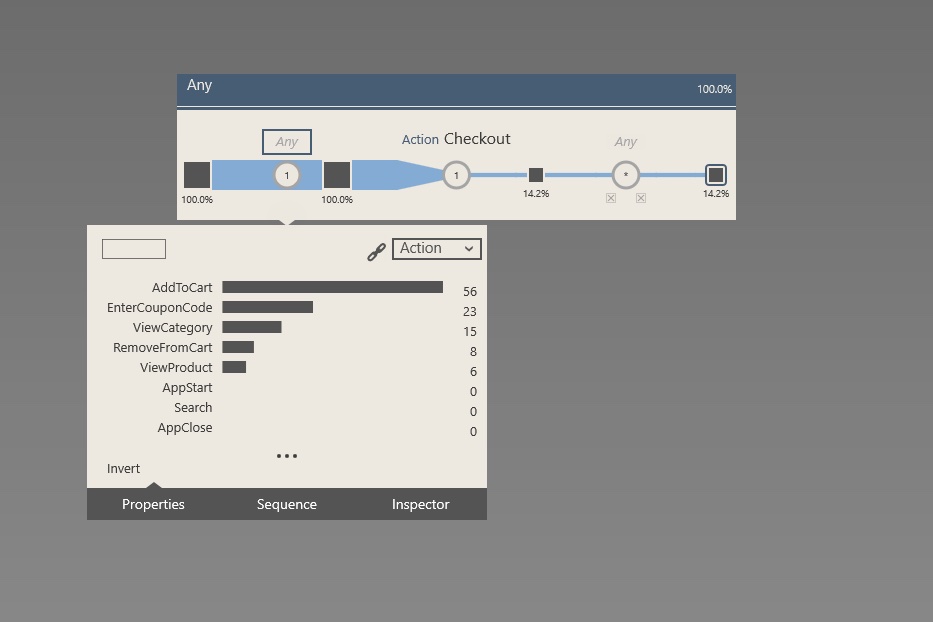
Sequences and streams
Visual tools for exploring logs of user traces and event sequences.
Microsoft Research
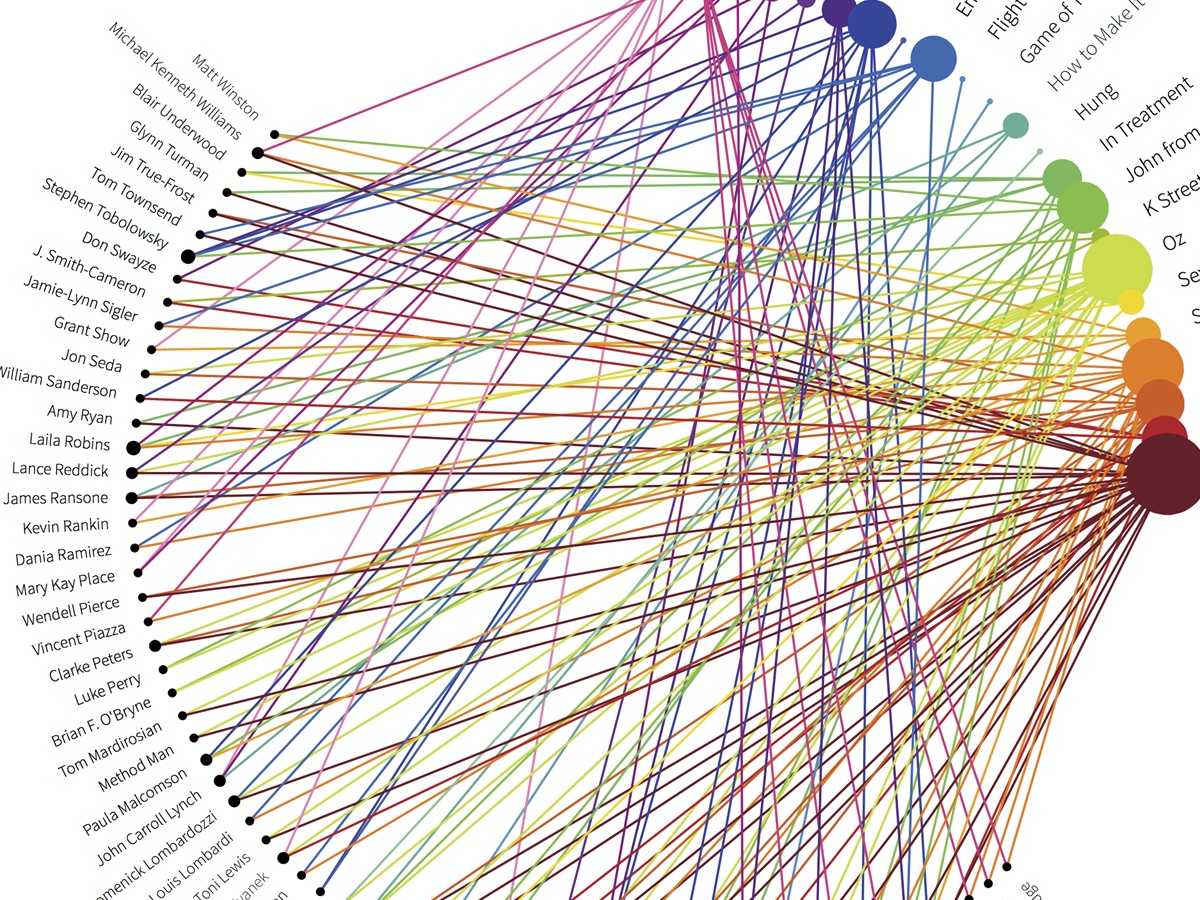
Progressive analytics
Approximate answers that get more precise as big queries run, so analysts can keep working.
Microsoft Research
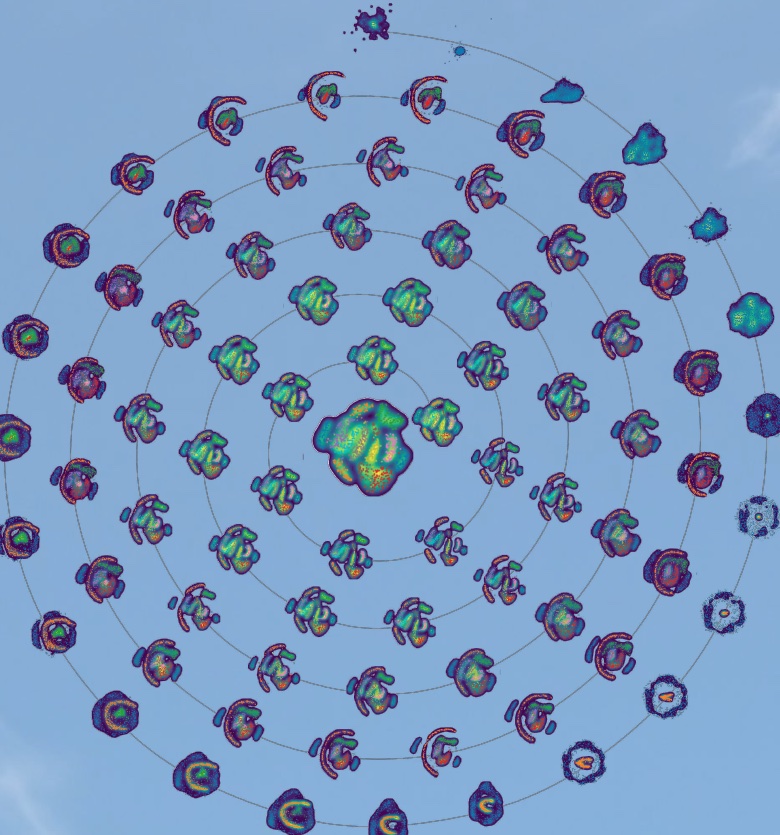
Tabletop analytics(opens elsewhere)
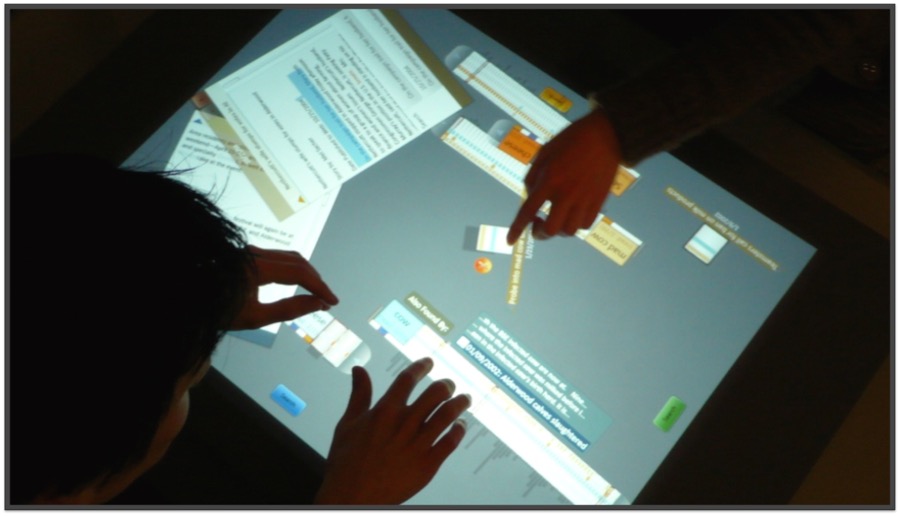
Cambiera supports collaborative visual analytics around a tabletop. Two analysts can work together to explore, share, and make sense of complex data.
Microsoft Research
Extending Excel with JavaScript(opens elsewhere)
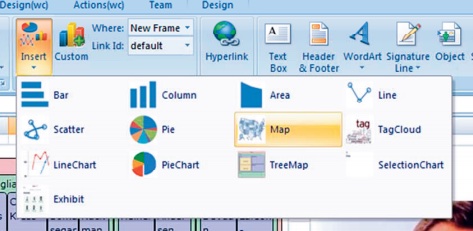
The WebCharts project was the design prototype that led to Apps for Office and Power BI Custom visuals.
Microsoft Research
Animating data(opens elsewhere)
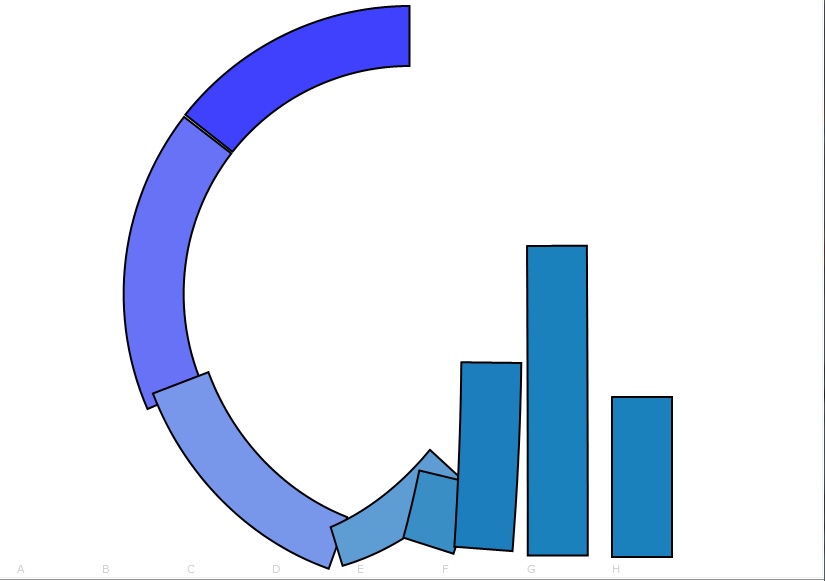
Understanding the pros and cons of animating data visualizations.
Microsoft Research
Personal projects
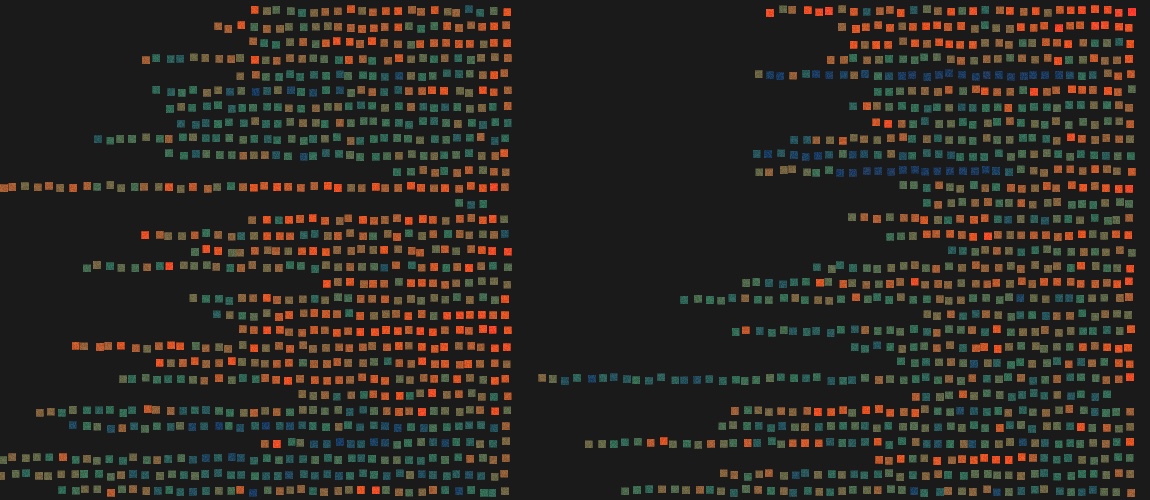
Torahmap
The Hebrew Bible placed on one spatial layout lets users explore its structure and relationships.
Side project
The degree-degree map
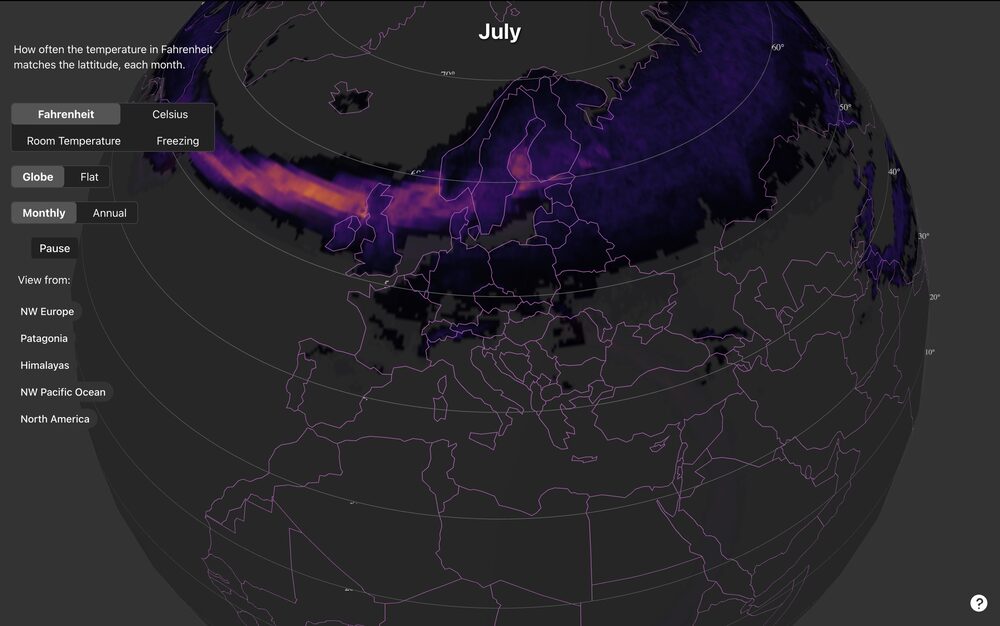
A whimsical exploration of a useless question: Where is it 68 degrees at 68 degrees of latitude? A demo of processing large data and building interactive 3D maps.
Side project · on the Data Blog
Since 2022
Torahmap
The Hebrew Bible placed on one spatial layout lets users explore its structure and relationships.
Side project
The degree-degree map
A whimsical exploration of a useless question: Where is it 68 degrees at 68 degrees of latitude? A demo of processing large data and building interactive 3D maps.
Side project · on the Data Blog
UX for data cleaning
A review of the user experience of Hyperparam, a bespoke tool for rapidly cleaning and transforming large datasets.
Client · on the Data Blog
Recce
Showing data engineers how a change to one model ripples through the pipeline, and comparing the data before and after.
Client
Automation at Moment
Interviews with infrastructure teams, turned into a product direction with maturity models.
Client · on the Data Blog
Honeycomb, 2018–2022
Service level objectives
How we built Honeycomb's SLO feature, from spreadsheet and notebook prototypes to a product, with Liz Fong-Jones.
Client · on the Data Blog
The Core Analysis Loop(opens elsewhere)
How users carry out the work of incident analysis and recovery.
Client
Microsoft Research, 2004–2018
Progressive analytics
Approximate answers that get more precise as big queries run, so analysts can keep working.
Research
Tabletop analytics(opens elsewhere)
Cambiera supports collaborative visual analytics around a tabletop. Two analysts can work together to explore, share, and make sense of complex data.
Research
Extending Excel with JavaScript(opens elsewhere)
The WebCharts project was the design prototype that led to Apps for Office and Power BI Custom visuals.
Research
Animating data(opens elsewhere)
Understanding the pros and cons of animating data visualizations.
Research