Data scientists with datasets too big to query interactively.
Data teams value interactive data exploration: the ability to freely and rapidly ask a series of questions about their data, and to see the results in real-time. For many datasets and many queries, either the sheer volume or the complexity of the query makes interactive analysis impractical.
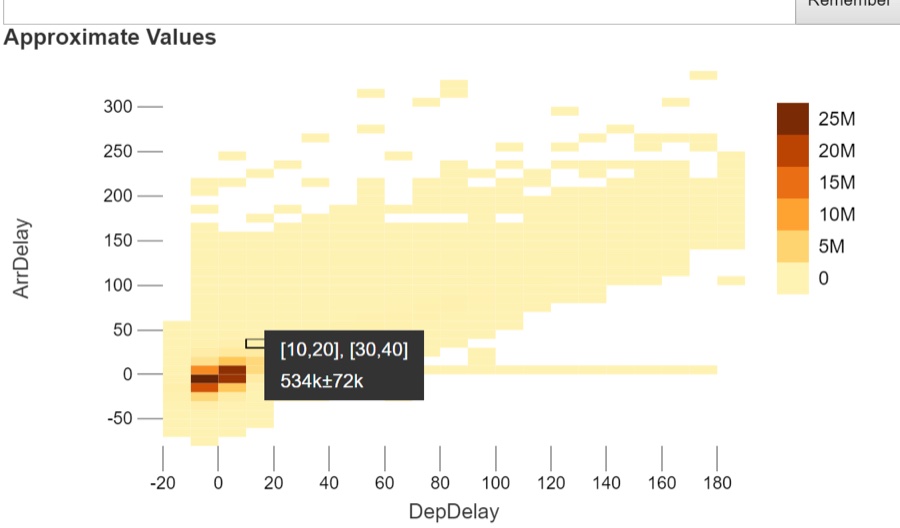
Waiting for every answer disrupts train of thought.
A long lag means that analysts lose their exploratory rhythm. Analysts reported that they had to exercise great patience, or prematurely jumped steps, tried to stack multiple analyses together, or gave up on their exploration.
“I was willing to wait 70–80 seconds. It wasn’t ideally interactive, but it meant I was looking at all the data.”
An analyst discussing their big-data tool. From Trust, but Verify
Analysts will explore with approximate answers, but want exact numbers before they report out.
We carried out a study in 2012 showing that providing a built-in method for computing partial results would dramatically speed up exploration, as long as the analyst had access to uncertainty information.
“If I want to give my boss specific numbers, I don’t want to use samples.”
From Trust, but Verify
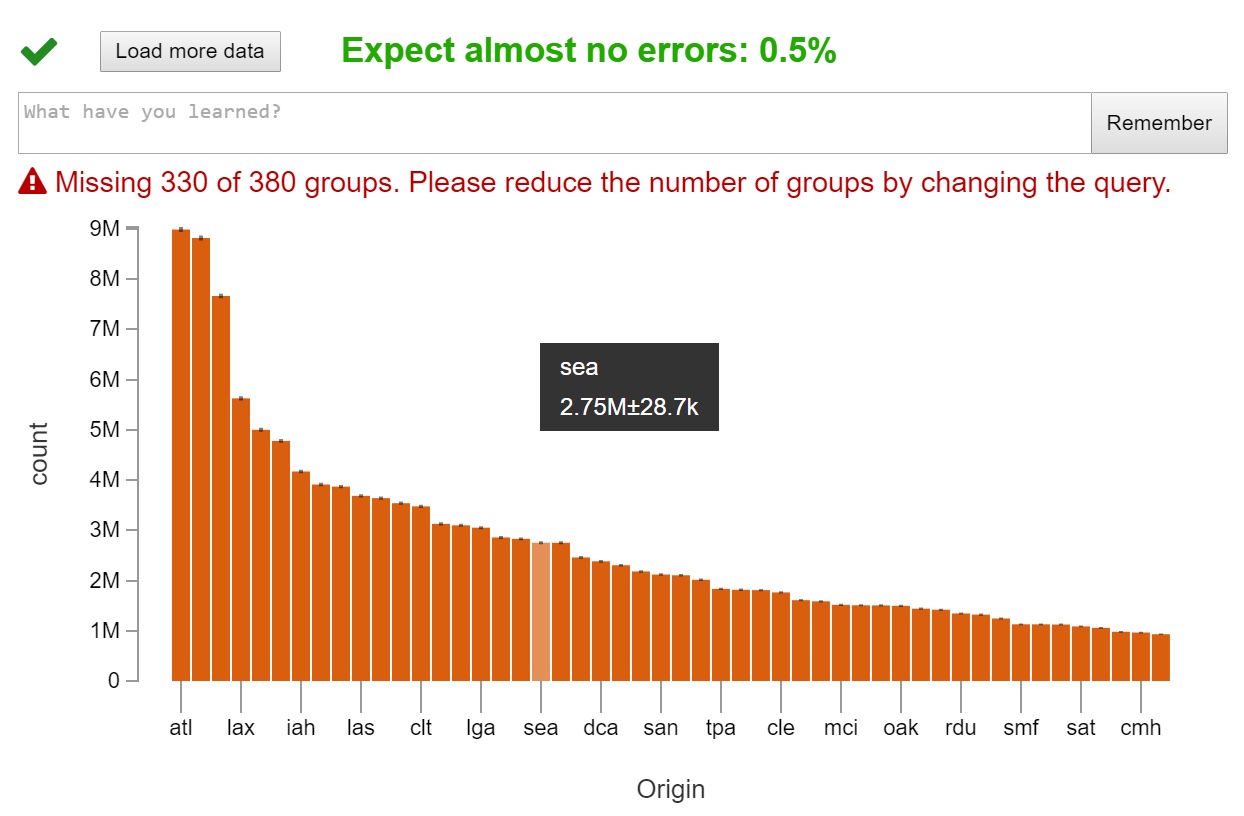
Pangloss: an approximate chart now, the exact one in the background.
We developed further prototypes, like Pangloss, which allows analysts to request the full data in the background while they continued exploring on partial results. Pangloss shows how far off the approximation was when the full result arrived, allowing analysts to backtrack if they learn they had counted on a bad approximation.
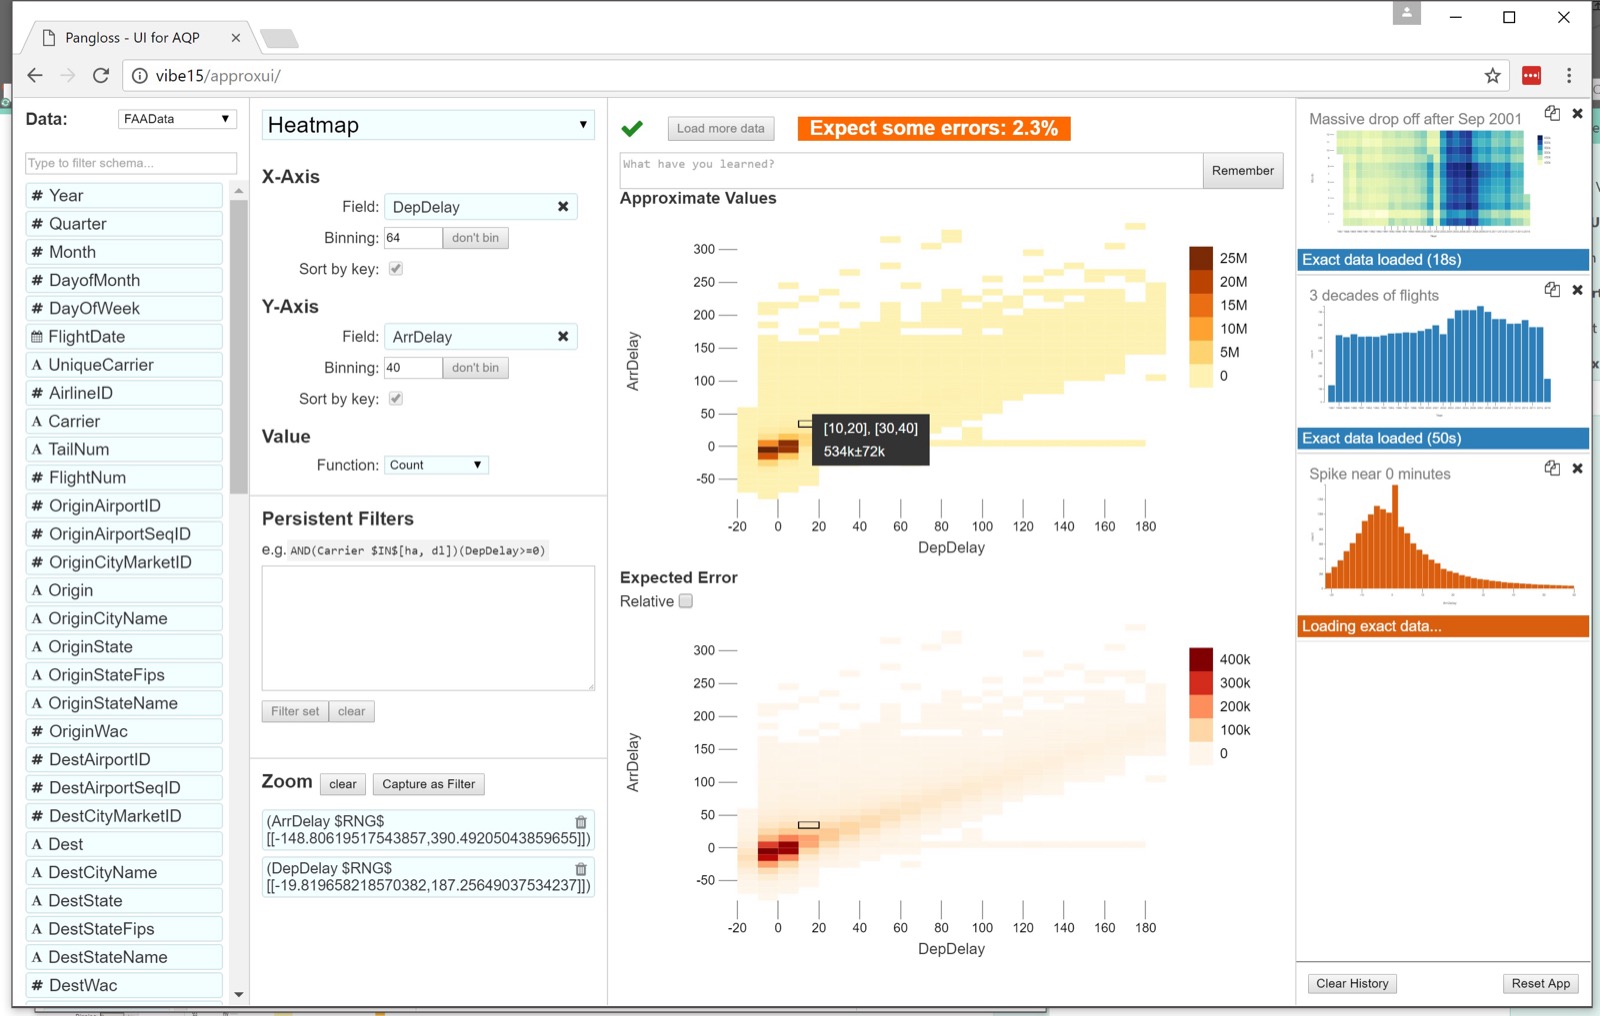
A Progressive Research Agenda.
We published a series of papers exploring the idea of progressive data analysis: moving from fast, sampled data to more-precise results. Data systems at Microsoft increasingly experimented with ways to flexibly move between approximate and exact results. The field kept growing: I co-led a 2018 Dagstuhl seminar, and a book I edited with Jean-Daniel Fekete and Michael Sedlmair.