Data engineers changing one model in a project of hundreds, or thousands.
dbt is the language of data transformation. Each model is expressed as a series of queries and operations on the ones upstream of it. Before they merge a change, they want to know whether there is unexpected downstream impact.
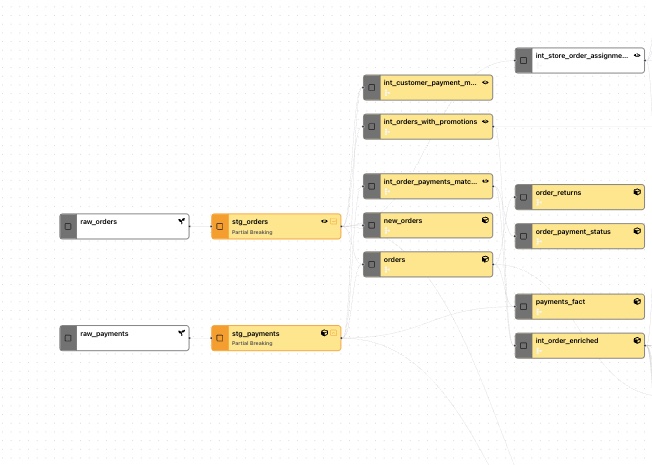
A small change can quietly touch columns many models away.
A small upstream change can have a huge downstream impact. A small change to a string operation, for example, might affect downstream JOIN and GROUP BY operations.
Changes can affect both the structure of the graph – which tables depend on which others – or the semantics of the data itself.
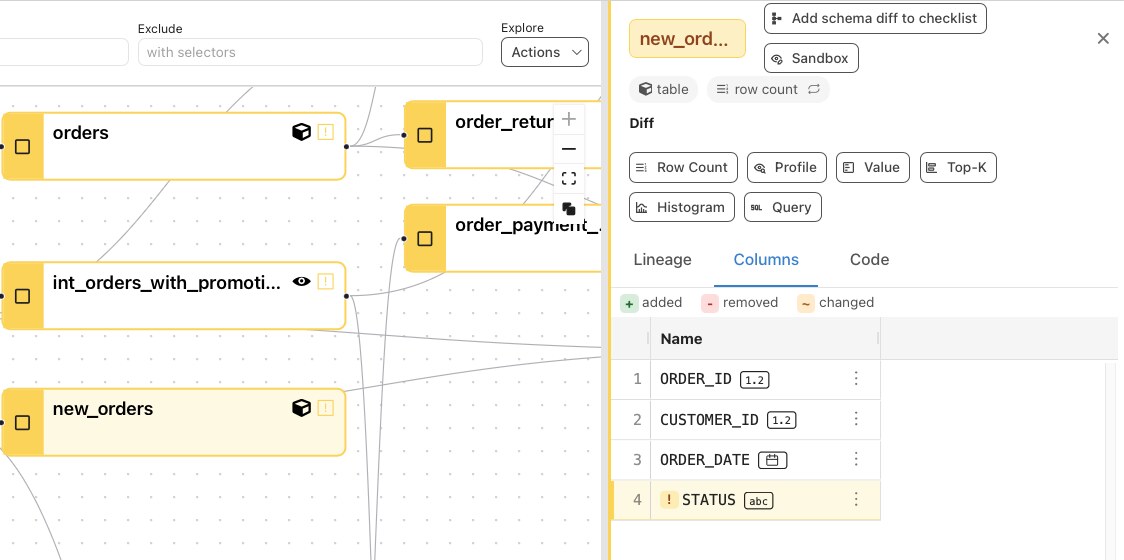
Watching users work with Recce.
We started by watching user telemetry, conducting interviews, and looking at server-side data. We learned about how many different tables could be impacted by the typical changes that our customers were making, and how far downstream those changes rippled.
We found that cascading changes were common: that it was common to make a small tweak that could touch hundreds of models – and that users felt responsible for ensuring data quality before merging.
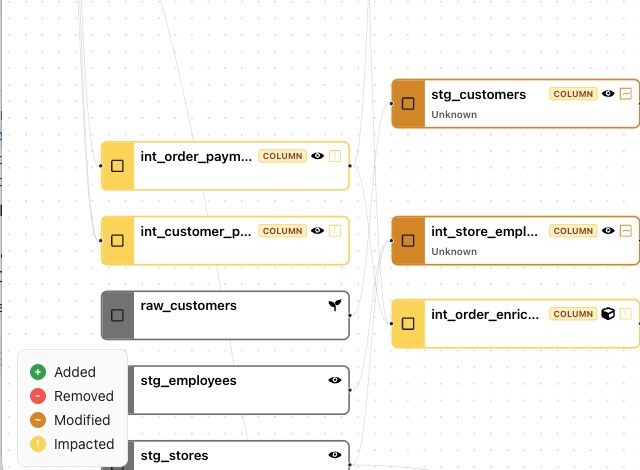
Impact on the lineage graph, and a before-and-after histogram for every changed column.
We made a series of changes that were all meant to help show what had changed in a model. The lineage overview clearly labeled each impacted model. When an analyst looked at a single model, we showed precisely which columns were impacted, and drew a small paired histogram to compare the previous and current versions.
We had to carefully balance which features were on by default: there was additional computational cost of computing the histograms and the lineage impact.
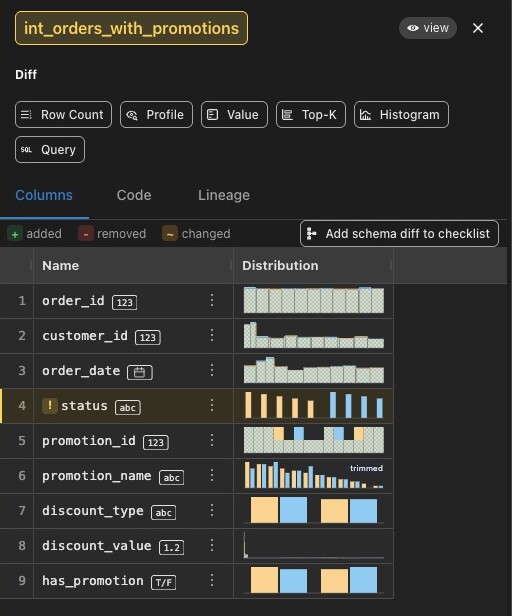
Recce with superpowered impact analysis.
The new lineage experience and the inline distributions landed in Recce, and were rolled out gradually to users.