Data scientists exploring logs of what people do in software.
Telemetry and log files record what people do in apps and online stores. The data scientists we talked to analyze sequences of events to repair interface issues and understand user behavior.
It's hard to ask “what happened next?” of millions of clicks.
Questions like “When do people abandon a shopping process?” and “How do people recover from errors?” are about tracking the order of events. Database query systems make it easy to ask how often a single event happened, but make it challenging to explore sequences. Some dedicated event-processing tools were limited in what they could express, or didn’t scale to large datasets.
A visual approach to exploring event sequences.
The analysts were familiar with regular expressions (regexes), and even used regular expressions as a way of describing event sequence patterns. However, conventional query tools available did not have a regex-like language for expressing these sorts of queries.
Two tools for regex-based visual queries.
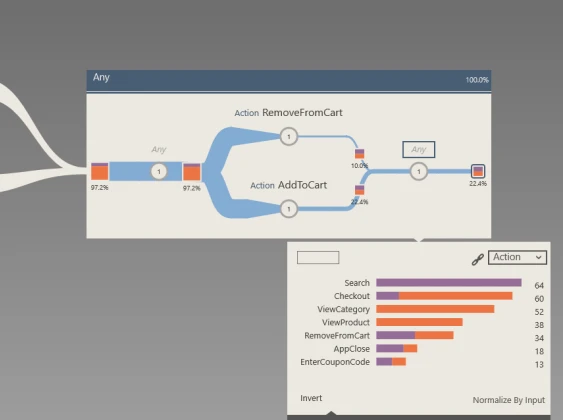
We built two different tools to explore this space. Our first prototype, (s|qu)eries, is a touch-based interface for building a regular expression visually. As the analyst places query nodes, the system shows how many sequences match the expression. It was limited in scope, and only worked on very small datasets.
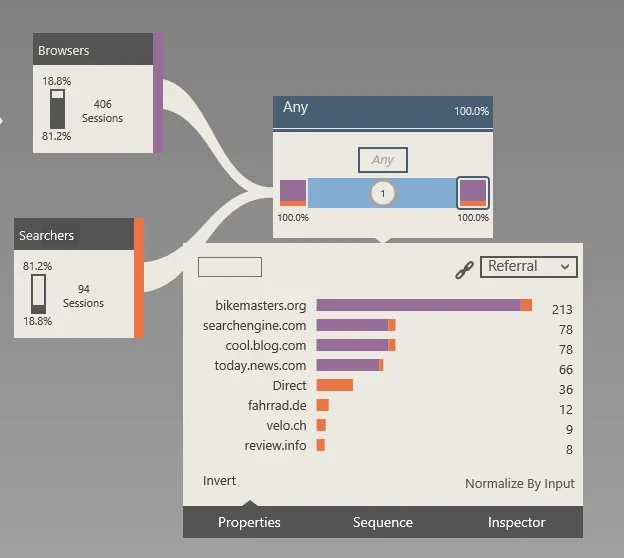
Its successor, Logan, addressed many limitations we’d found in the prior project. It runs on a streaming engine, Trill, so it could scale: results dynamically update while more data is read and processed. Logan opens with a bar chart of the events in the data, and makes it easy to compare cohorts of users.
A research agenda on event analytics.
(s|qu)eries was published at CHI 2015, with Emanuel Zgraggen, Steven Drucker and Robert DeLine. Logan was a position paper at the IEEE VIS 2016 workshop on temporal and sequential event analysis, describing what changes from one event dataset to the next.
These projects helped influence event analytics tools at Microsoft and beyond, encouraging teams to add regex-like capabilities and streaming interfaces.